For the longest time its felt like, not only are we under performing but we are second best in every game. Regardless of who we were playing, when or where they seemed to outperform us all over the park apart from where it really mattered, goals. We're all aware of how a lot of our results have been in spite of our performances thanks to good finishing, largely from Marriott before his injury. After the Doncaster game when it was truly evident (despite not being mathematical) it was season over, I wanted to see exactly how much my feelings were warranted. Some of the results surprised me, many did not.
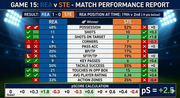
Using combined resources, predominantly BBC Match Stats and whoscored.com, I collected and compiled the data from all 29 of Leam's league games. I chose metrics that I thought were most indicative of a team performance irrespective of match result (as much as possible). I then compared these head to head with our opponents and assigned a constant numerical value to each metric which would either be added or subtracted depending on who outperformed who. If we won a particular duel we'd get a green tick
 and if we lost we'd get a red cross
  .
.The particular data points used were:
Possession: %
Shots:
Shots on target:
Corners:
Pass Acc: %
SFTP/TP: Successful final third passes/total passes %
Key passes:
Tackle success: %
Touches in opposition box:
Avg player rating:
Action zones in our final third (lower better): % - Where the game was played.
BP/TP: Backward passes/total passes %. - This was included in the individual H2H but not in the calculations as I found it too stylistic and not necessarily performative, for example team's that recycle backward to immediately launch forward attacks.
>50%
bonus: If more than half - if we won more than half of the individual metrics and got a green tick, we'd get a +0.5 bonus. Away Multiplier: x/÷1.5: - From my research a team is has an approximate 50-60% disadvantage for being away and so I 'boosted' our away performances.
An example of this from his first game:
The Results:
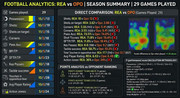
* compiled heatmap: left: home, right: away
*Full Data Set
https://docs.google.com/document/d/e/2P ... 8v0Hin/pub
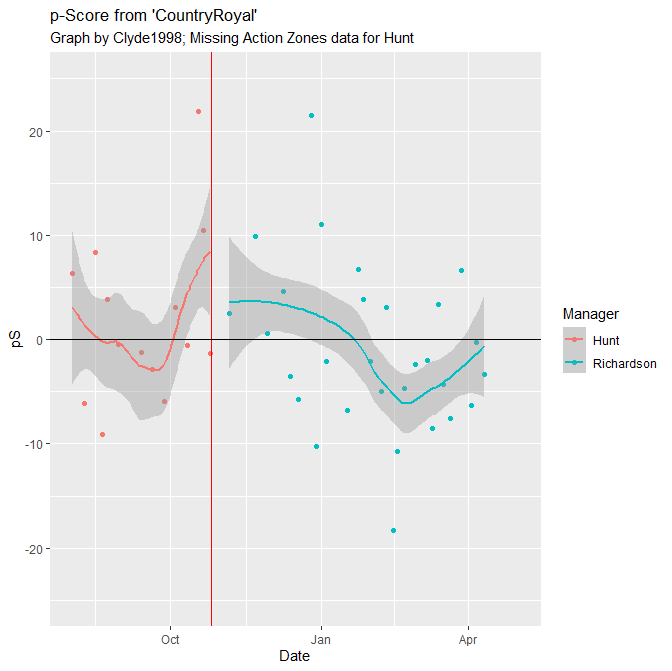
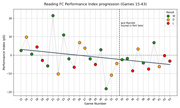
Adding up all of the data points via the marked value assigned to each one (on a baseline of 0) gave a custom performance score (pS) which subsequently plotted on a graph.
Observations & Notes:
- We played more games against teams below us (17) than teams above us (9) with our opponents on average 2 points below us.
- The best performance (1-4 away at Plymouth: pS +21.53) was heavily influenced by the sending off in the 12th minute.
- Disregarding the two outliers (Plymouth and the 3-2 home v Wycombe: pS -18.32) there were 17 'negative' performances compared to 10 'positive performances'. Performances have, justifiably, dropped since Marriott's injury.
- Our two consistently worst stats were game time spent in our own third and our successful final third passes which reconfirm that we do we struggle to get into dangerous areas, and when we do we are quite ineffective. Away at Mansfield (Game 34) almost an entire half of football (48%) was spent in and around our own penalty area.
- We were outperformed by teams consistently on everything bar one metric - possession with us seeing more of the ball in 15 games compared to 13. Over the season the average possession was 50%, however.
- *Interestingly our average player rating over the season was higher than the opposition, even though we only had higher ratings in just over half the games. This was probably influenced by Lewis Wing's and Paudie O'Connor's consistently high ratings, and a couple of hattricks.
Methodological Reflexivity
Because I'm not blind and it's obvious to everyone that the football is objectively diabolical, I already had a bias before instigating data collection, whilst this didn't affect how I chose the data, I felt compelled to grade positively to compensate, and therefore was more rewarding to us than maybe (ironically) true objectivity would have permitted. For example; giving us a bonus for matches in which we came out on top in more than half of the data points, and not punishing us further when we didn't, and giving us a 50% performance boost away from home to compensate for a disadvantage, but then not doing the opposite for our home performances. Ftr that could have gotten messy! Additionally, as already stated, I didn't use BP/TP towards a pS value but still incorporated it into the total win/lose h2h which could have ultimately impacted the final score, marginally admittedly. Lastly I initially wanted to factor in opposition's league standing but my limited research on that suggested, surprisingly, it wasn't significant, at least not comparatively to home/away advantage.
Data Limitations
It should go without saying but obviously statistics never tell the whole story. Some are more illuminating than others, but all are nuanced and are multifactorial, not necessarily indicative of success. See Lincoln.
Data Cleaning
Collection was 99% manual. I would have liked to have harvested the statistics more easily but I could choose ease or accuracy, not both. The only exception was getting the average heatmaps - I took all 29 home/away then averaged out 3 of each as each one was quite different, albeit still telling the the bigger picture. I couldn't even use AI for reliable (easy) calculations which was shocking, so still had to manually do it, maybe Julius would have been better but I wasn't about to pay for it. Presentation was multi-modal including various different AI platforms - no need to explain why that could be problematic! There are some obvious ones, as I'm sure you will all spot. It was trial and error to get something remotely acceptable but still had to use photoshop etc for a couple of corrections.
Should Leam stay or go?
I don't know. Its a hard one, on one hand results have, by and large, exceeded performances but this isn't a sustainable long term approach. Good teams win when playing badly, but they also play well more often than they don't. That isn't the case with us and we cannot shithouse our way to Championship survivability. I do believe that a manager should have time to build what he wants but what if what that is, has us doomed? I do believe the squad we have is underachieving and if the goal was to better last season it will be an objective failure. He hasn't shown many signs of being able to adapt but unlike players who we think can grow and improve (Will Keane aside) we expect manager's to be the finished article. He might still learn and may deliver on the footballing philosophy he promised, but he better learn fast.